
 Vendor Reports
Syncrostore provides a set of detailed reports to help you track sales, monitor inventory, analyze profitability, and manage rental activity. To access your reports, navigate to the Reports section under Vendor Tools.
Note: Syncrostore now supports Multi-Store vendor reports! This means that if you are a vendor across several stores, you have the ability to view reports at each store individually, or across all at once.
Available Reports:
We currently supply the following reports for Vendors. Feel free to click any of the following to read more:
Navigating Reports
Each report opens with summary statistic cards and graphs shown initially. These are provided for convenience and for easily viewing tends or noticing anomalies within sales, inventory, etc.
Scrolling down you will find a detailed grid relating to the information shown. Each row will represent different data, for example, the Vendor Sales report shows information about sales in the date range, while the inventory report shows individual items and their information.
Tip: All reports are customizable, for more information see the How to Customize Dashboards and Reports dedicated article.
Changing Store View
If you are a vendor with booths at several storefronts, you have the ability to view all vendor reports at an individual store level, or all together as an overview. This allows you to easily compare and contrast data from all the stores you currently sell at.
- In the top right corner of the reports, you will find the Store Selector drop-down menu:
- Opening this menu will show you all stores which your user (email address) is currently registered as a vendor at.
- You have the option to select a specific store, or all stores in the drop-down
Filtering by a Date Range
-
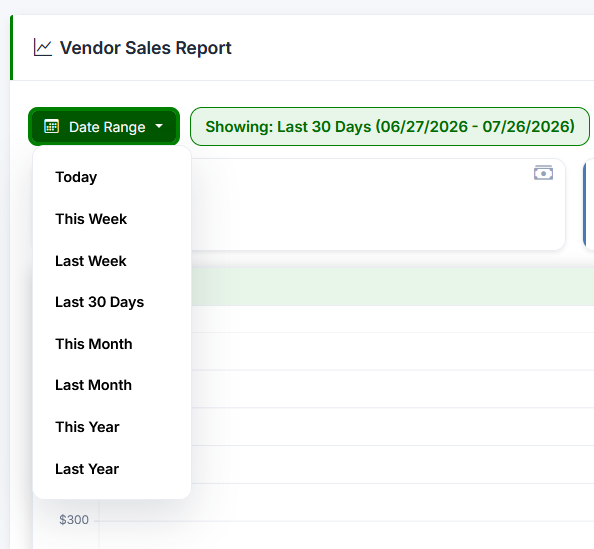
Certain reports can be scoped by date using the Date Range filter found in the top left of the report. For example:
-
If you would like custom date range, please use the filter found on the grid at the bottom of the report, and locating the respective time column to filter by. For example, on the Vendor Sales report, each transaction has a date, so we will filter the date using the following flow:
Using the Detailed Grid (Filtering, Sorting and Grouping Columns)
The detailed grid found at the bottom of the reports provides many opportunities for filtering, grouping, sorting, or otherwise customizing what is shown for your needs.
Choosing your Columns
Each report has specific information displayed in the grid. You have the ability to change what information is shown on this grid, and this will be reflected in any export you perform as well.
- To change what columns are shown, locate the Column Chooser button found at the top of the grid:

- Clicking this button will open a drop-down menu of all potential columns to be shown on that report, for example the Vendor Sales drop-down:
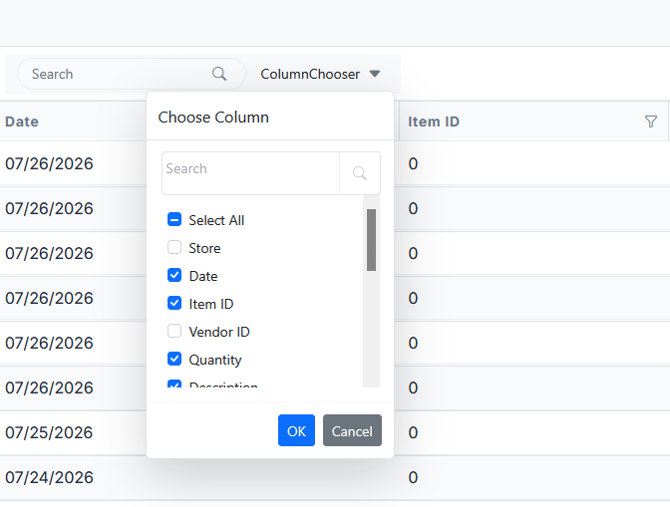
- You can enable or disable a column by checking, or unchecking is respective box in the menu.
Filtering
- A basic search function can be found at the top of the grid. This will search all columns for a value you enter:

- For more control, you can filter a specific column by specific values by clicking on the funnel shown to the right of the column name. For example, to filter by description on the inventory report:
- You can change the filter type, such as contains, starts with, or equals to. Make sure to check your filter type if you believe the filter is not working.
Sorting
- Sorting columns allows you to view the data in ascending or descending order.
- This can be accomplished by clicking on the column title itself, which will place the data in descending order. Clicking again will flip the data to ascending order, and clicking once more will remove the sorting.
- See this example of sorting Item Name in the Inventory report:
Grouping
- Grouping allows you to combine similar values into one drop-down within the grid. This has many uses, from grouping items by date added, to customers by what year they joined, the options are limitless and we encourage you to experiment!
- To group, simply drag the column header you would like to the space above the grid labeled, "Drag a column header here to group its column".
- For example, to group by quantity in the Vendor Sales Report:
Switching Pages
If enough data is present for a selected date range, the report grid may be broken into several pages.
- You can switch between pages, and change the amount of data shown on each page using the controls found at the bottom of the grid:

Tip: If there's a report you need that isn't currently available, email our support team with details about what information you'd like to see. We actively consider vendor feedback when developing new reports.
Exporting Reports
To export your report to a desired format (CSV, xlsx, or others), locate the export button and type drop down at the top right of the page.
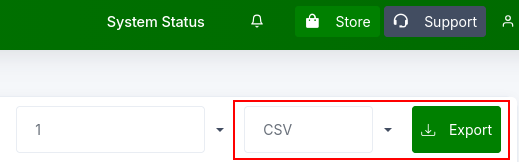
The drop down will allow you to switch between export formats as needed. CSV and Excel are the most supported formats, and are generally recommended for exporting needs. PDF can be used to quickly create a printable or shareable document as well.
Notice: Any applied filters will affect the data exported using this button.
Be Aware: At this time, customizing the grid does not change what is displayed on the summary cards or graphs.
