
Vendor Reports
Syncrostore provides a set of detailed reports to help you track sales, monitor inventory, analyze profitability, and manage rental activity. To access your reports, navigate to the Reports section under Vendor Tools.
Note: If you manage multiple booths or vendor accounts, use the drop-down at the top right of the screen to switch between vendor IDs and view reports for a different booth.
Available Reports:
Sales Report
-
A vendor-specific snapshot of sales over a selected date range. Shows total sales, number of units sold, refunds and returns, breakdown by payment method, and cash amount of discounts given.
- Grid Options:
- Transaction Date (When the transaction occured)
- Quantity (Quantity purchased in that transaction)
- Description (Including Variant Description)
- Gross Sales, Net Sales
- Item ID, Vendor ID, Transaction ID (Identifier for the item purchased, Vendor it was bought from, and associated transaction)
- Discount (Discount percentage applied to that item)
- Profit (Requires item to have an associated Cost)
- Commission Rate (Store wide commission rate)
- SKU/UPC
Inventory Report
-
A live listing of your current stock across all items and store locations. Includes quantities on hand and total inventory value. Also surfaces low stock indicators and ageing information to help you prioritize reordering, reduce stock outages, and maintain accurate records.
- Grid Options:
- Item ID (Unique ID generated by Syncrostore for internal identification)
- SKU/UPC
- Description
- Quantity (Current on hand quantity)
- Price (What you are charging for the item currently)
- Date Purchased (When you acquired the item)
- Age (Days since you acquired the item)
- Cost (Amount the item cost you to acquire)
- Original Price (Price for the item when originally added)
- Date Added (Date you added the item to Syncrostore)
- Vendor ID (Associated Vendor ID)
- Category (Associated item category, if applicable)
- Condition (Associated Item condition, if applicable. Worn, Fair, Factory New, etc)
- Brand (Associated Branding, if applicable)
- Notes (Internal Notes, if applicable)
- Tags (Syncrostore generated tags for items)
- Offer Shipping (If shipping is offered)
- Publish Local/Online (If published on Trinket Vault)
- Weight (Shipping weight)
- Date Modified (Date the item was last modified)
Cost Profit Report
-
A detailed breakdown of product costs and resulting profits, presented by product, vendor, and time period. Displays gross and net profits, margin percentages, and trend analysis to help you evaluate pricing, assess supplier impact, and understand overall profitability. Requires that Cost of Item and Date Purchased fields are filled in on your inventory items to be useful.
- Grid Options:
- Item ID (Unique ID generated by Syncrostore for internal identification)
- Description
- Cost Per Item (Amount the item cost you to acquire)
- Asking Price Per Item (What you are charging for the item currently)
- Item Profit Per Sale (Profit, or price minus cost per sale)
- Quantity (Current on hand quantity)
- SKU/UPC
- Total Cost of Items (Quantity of item multiplied by cost per item)
- Total Sale Price Of Items (Quantity of item multiplied by price per item)
- Total Item Profit (Total Sale Price minus Total Cost of Items)
- Profit Margin (Profit divided by Asking Price, as a percentage. For example a $5 profit on a $10 item would be a 50% profit margin.)
- Date Added (Date you added the item to Syncrostore)
- Age (Days since you acquired the item)
- Category (Associated item category, if applicable)
- Offer Shipping (If shipping is offered)
- Published (If published on Trinket Vault)
Rent Report
-
A ledger of booth or space rental activity showing credit, debit, and deposit history. Simplifies reconciliation and helps ensure accurate accounting for rental expenses and income.
- Grid Options:
- Credit Debit Amount (Amount either added or subtracted from your vendor balance. Negative values, or debits, are surrounded in parentheses.)
- Credit Debit Type (Short description of the credit or debit, e.g. rent)
- Space ID (Identifier associated with the booth/space for rent)
- Item ID (Currently unused)
- Date Updated (Date the transaction was last updated)
- Transaction ID (Identifier for a transaction)
- Store ID (Store in which the charge was initiated at)
- PP Transaction ID (Currently Unused)
Tip: If there's a report you need that isn't currently available, email our support team with details about what information you'd like to see. We actively consider vendor feedback when developing new reports.
Navigating Reports
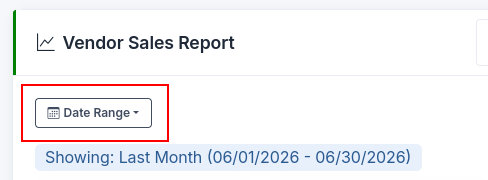
Each report opens with summary statistic cards and graphs shown initially. These are provided for convenience and for easily viewing tends or noticing anomalies within sales, inventory, etc. Certain reports can be scoped by date using the Date Range filter found in the top left of the report.
Scrolling down reveals a grid in which the report data is shown more directly. This can be utilized for digging into a specific sale, item, or settlement, and viewing all it's associated data.
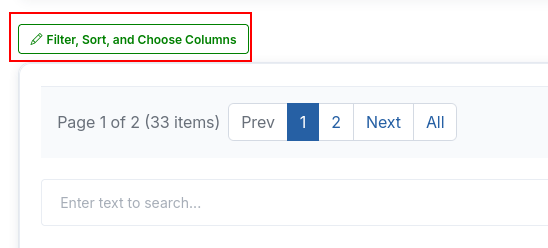
The detailed grids provide many opportunities for filtering, grouping, sorting, or otherwise customizing what is shown for your needs. To customize, select the Filter, Sort, and Choose Columns button shown at the top of the grid.
The menu at the top of the popup explains each feature in detail, and where to locate them.
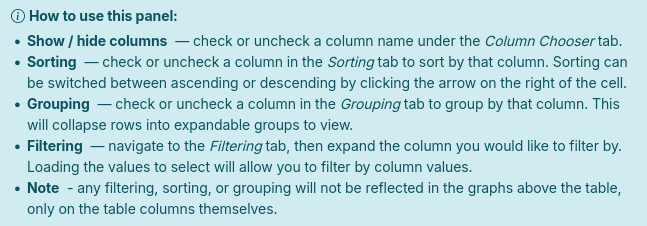
Combining these features allows for any desired combination of data to be displayed on the grid.
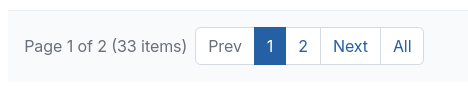
Lastly, located below the Filter, Sort, and Choose Columns button are the page and page size selection menus.
Exporting Reports
To export your report to a desired format (CSV, xlsx, or others), locate the export button and type drop down at the top right of the page.
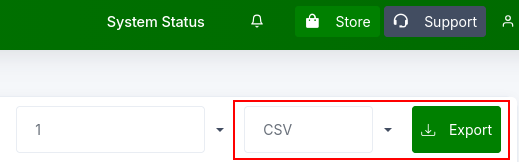
The drop down will allow you to switch between export formats as needed. CSV and Excel are the most supported formats, and are generally recommended for exporting needs. PDF can be used to quickly create a printable or shareable document as well.
Notice: Any applied filters will affect the data exported using this button.
Be Aware: At this time, customizing the grid does not change what is displayed on the summary cards or graphs. This may change in the future