
Syncrostore dashboards and reports you to customize the way your reports look to personalize the way you view your store/booth's data. Both Key Performance Indicator cards (KPI cards), and graphs/visual elements can be moved, resized, or completely removed from the display entirely.
Enabling and Disabling Displays
If you find yourself not wanting to see a specific statistic, graph, or KPI card, you have full control to turn them on and off whenever you would like.
- Locate the Customize button found in the top right of both dashboards and all reports
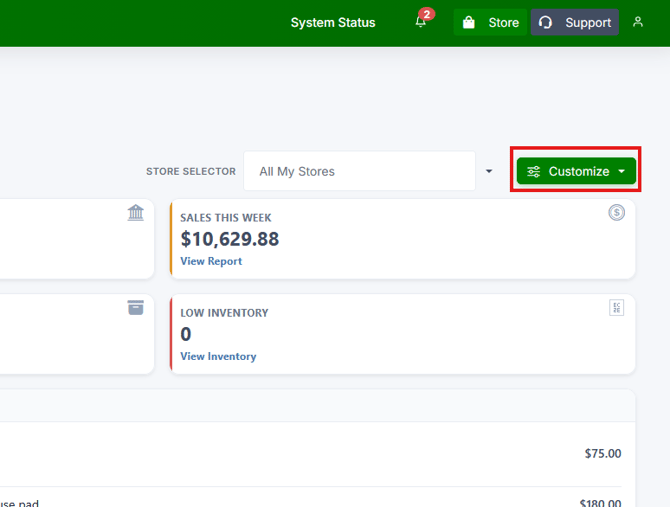
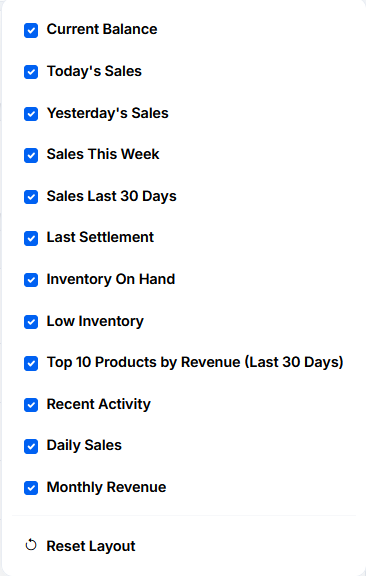
- Clicking this button will open the drop-down menu where you can simply check which data you would displays, and uncheck what you would like to be hidden. For example, the Vendor Dashboard has the following options:
- If you would like to return to the default layout you can choose Reset Layout. Note that this will also move all elements to their original position.
Dragging/Moving
You have the ability to reposition any element on the dashboard and all reports to anywhere on the screen you would like.
- To move an element, simply hover over it and click and drag.
- You will notice elements are automatically snapped to a grid for consistency, while still allowing complete freedom of where they are placed on your screen.
- To reset the position of all elements, you can open the Customize menu and select Reset Layout (see Enabling and Disabling Displays above).
- See an example of customizing the Vendor Dashboard below:
Resizing
The last customization option you have for dashboards and reports is the ability to resize elements. If a graph or card takes up too much space, or you would like it to be bigger on your display, you can now fix the issue by resizing!
- To resize, you will need to hover your mouse over the bottom right corner of the element you want to adjust. You will know you are in the right area when your cursor changes shape to be two arrows pointing in opposite directions:

- Once you are hovering over the bottom right corner, you can click and drag to vertically or horizontally adjust the size of the element. Once you are satisfied with its size, just let go and it will stay in place.
- Below is an example of changing the size of a graph on the Vendor Dashboard (Note the position of the cursor in the bottom right of the graph):
Tip: If you find yourself unhappy with your layout and would like to revert to default settings, simply click the Customize button found in the top right, and select Reset Layout. This will reset the current page to its original layout for you to begin customizing again.
