
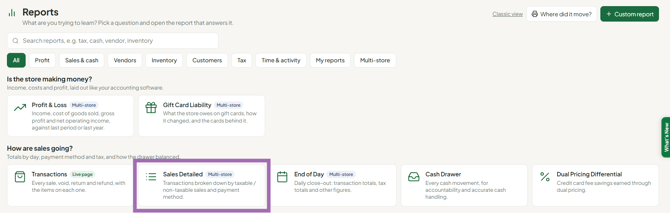
The Sales Detailed report shows every transaction for a date range you choose, one row per sale, broken out by how it was paid, what was taxable, and how much tax was collected. Open it from Reports, under Sales & cash, by choosing Sales Detailed.
Who this is for: Store admins.
These steps use the New Experience. If your menu looks different, click Switch to New Experience at the top of the page.
Use it to reconcile a drawer, verify a deposit, review a cashier's day, or pull numbers for a sales-tax filing.
Open the report
- Go to Reports.
- Under Sales & cash, choose Sales Detailed. (Or type "sales" in the Search reports box.)
Summary cards
- Taxable Sales - total of taxable items sold, before tax.
- Non-Taxable Sales - total of non-taxable items sold, plus any gratuity (tips).
- Tax Collected - total sales tax collected.
Charts below the cards trend these same figures over the selected range.
Date range
Use the date range control at the top of the report: pick a preset, or enter your own start and end dates. The cards, charts and table all refresh together.
- Start and end dates are both included.
- Filtering is by calendar day, not time of day.
- Transactions list newest first.
Customize
Select Customize (top right) to show or hide columns and panels. Your choices also carry through to exports.
Export
- Set your date range and any filters first.
- Pick a format from Export Format: CSV, Excel (XLSX) or PDF.
- Select Export.
The file contains exactly what's on screen - same range, filters, sort and visible columns. It builds in your browser, so the page won't reload.
Tip: use CSV or Excel when the numbers will be worked on further; use PDF when the report is shared or filed as-is.
Multi-store viewing
If your store belongs to a group, a store scope picker appears in the header with the group name and store count beneath it. On the Reports page, the Multi-store chip shows the reports that support this.
- Choose a scope to report across every store at once; a Store column is added.
- Each summary card gains a By store link showing the figure split per store.
- Date range, Customize and Export all apply to the whole scope.
If your store isn't in a group, the picker is hidden and the report covers your store only.
FAQ
- Why does one transaction show amounts in several payment columns? That's a split payment - the customer used more than one tender. Each lands in its own column, and Total Amount is the sum.
- Why doesn't Credit Card match my processor's batch total? Tips sit in the Gratuity column instead. Add Gratuity to Credit Card to compare.
- Why is gratuity counted in Non-Taxable Sales? Tips aren't taxable merchandise, so they're grouped with non-taxable amounts. Watch for this on heavy-tip days.
- Where are the individual items? This report summarizes at the transaction level. For line-by-line detail, open Sales > Transactions and expand a sale, or use the item-level sales reports.
Troubleshooting
- One of my stores is missing from a group view. A store is left out if its data can't be reached at that moment; the rest of the group still reports normally. If it stays missing, contact support.
- Nothing shows up at all. Check the date range first - that's the usual cause. If the range is right, confirm you're viewing the store or scope you expect.
