
Overview
The Admin Vendor Sales report allows you as an administrator to view sales across your store on a vendor by vendor basis.
The report consists of various KPI cards and graphs to supply information like Gross Sales, Net Sales, Store Earnings and more.
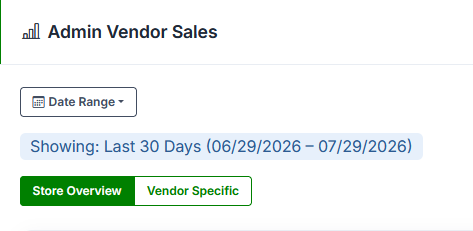
The report is broken into two views Store Overview, and Vendor Specific view. You can toggle between these two views with the switch found near the top of the report:
Store Overview
In the Store Overview view, you will see top performing vendors by sales, and top performing categories store wide. This can help you understand what vendors in your store perform the best, and potentially what categories are hot at the moment.
Vendor Specific
In the Vendor Specific view, you will have the ability to sort the data shown by vendor using the drop down found to the right of the view switch:
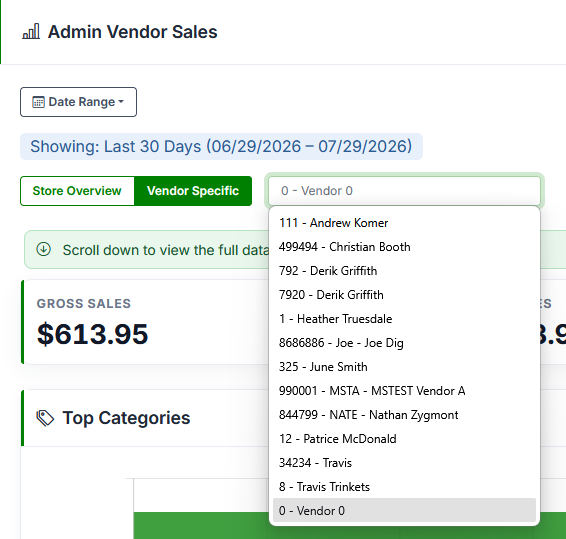
This drop down will show vendors who have had at least one sale in the selected date range. Choosing a vendor will display their statistics specifically, filtering the grid below the graphs as well to only transactions with their Vendor ID.
Navigating Reports
Each report opens with summary statistic cards and graphs shown initially. These are provided for convenience and for easily viewing tends or noticing anomalies within sales, inventory, etc. Certain reports can be scoped by date using the Date Range filter found in the top left of the report.
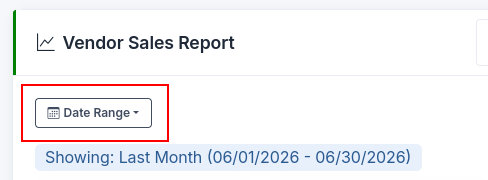
Scrolling down past the graphs reveals a grid in which the report data is shown more directly. This can be utilized for digging into a specific sale, item, or settlement, and viewing all it's associated data.
The detailed grids provide many opportunities for filtering, grouping, sorting, or otherwise customizing what is shown for your needs. To customize, select the Filter, Sort, and Choose Columns button shown at the top of the grid.
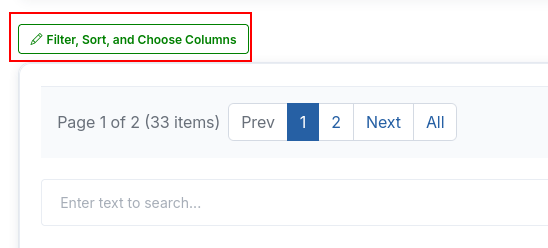
The menu at the top of the popup explains each feature in detail, and where to locate them.
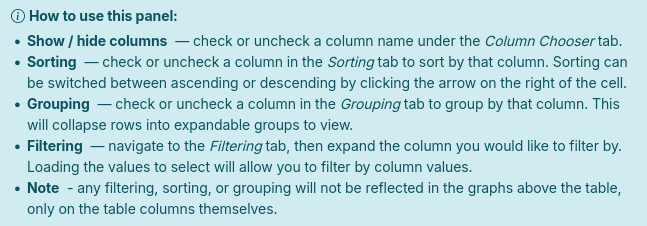
Combining these features allows for any desired combination of data to be displayed on the grid.
Lastly, located below the Filter, Sort, and Choose Columns button are the page and page size selection menus.


Exporting Reports
To export your report to a desired format (CSV, xlsx, or others), locate the export button and type drop down at the top right of the page.
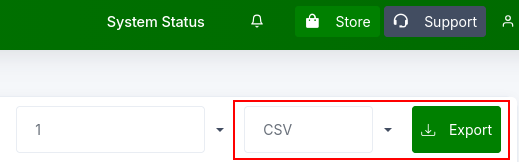
The drop down will allow you to switch between export formats as needed. CSV and Excel are the most supported formats, and are generally recommended for exporting needs. PDF can be used to quickly create a printable or shareable document as well.
Notice: Any applied filters will affect the data exported using this button.
Be Aware: At this time, customizing the grid does not change what is displayed on the summary cards or graphs. This may change in the future.
